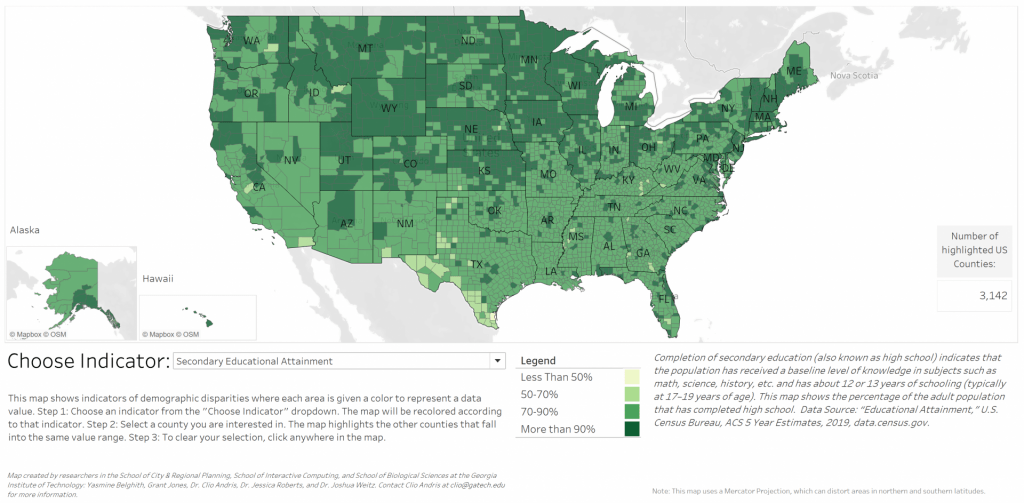
Contextualized Air Quality Timelines (ContAQT) is an air pollution data platform to visualize local AQI values over time and teach users about the multiple pollutants measured in air quality ratings. The ContAQT platform is part of our AQI Data Literacy project.
Although artificial intelligence (AI) is playing an increasingly large role in mediating human activities, most education about what AI is and how it works is restricted to computer science courses. This research is a collaboration between the TILES lab, the Expressive Machinery Lab (Dr. Brian Magerko, Georgia Tech), and the Creative Interfaces Research+DesignStudio (Dr. Duri Long, Northwestern University) to create a set of museum exhibits aimed at teaching fundamental AI concepts to the public. In particular we aim to reach middle school girls and students from groups who are underrepresented in computer science.
Creature Features asks learners to build their own training dataset to teach an AI what a bird is. After choosing examples and non-examples, learners receive feedback on how well their AI is able to identify new birds.
This 4-year project is funded by the NSF Advancing Informal STEM Learning (AISL) program (NSF DRL #2214463). We are collaborating with the Museum of Science and Industry in Chicago to conduct focus groups, needs assessments, and pilot testing of exhibit designs based off our prior work.
Knowledge Net asks learners to use tokens to create a network that powers a chatbot. After uploading an image of their network to a custom website, learners can ask the chatbot questions.
This research will explore how embodiment and co-creativity can help learners make sense of and engage with AI concepts.
Publications
Kafai, Y. B., Proctor, C., Cai, S., Castro, F., Delaney, V., DesPortes, K., Hoadley, C., Lee, V. R., Long, D., Magerko, B., Roberts, J., Shapiro, B. R., Tseng, T., Zhong, V., & Rosé, C. P. (2024). What Does it Mean to be Literate in the Time of AI? Different Perspectives on Learning and Teaching AI Literacies in K-12 Education. In Lindgren, R., Asino, T. I., Kyza, E. A., Looi, C. K., Keifert, D. T., & Suárez, E. (Eds.), Proceedings of the 18th International Conference of the Learning Sciences – ICLS 2024 (pp. 1856-1862). International Society of the Learning Sciences. https://repository.isls.org//handle/1/10828
Yasmine Belghith, Atefeh Mahdavi Goloujeh, Brian Magerko, Duri Long, Tom Mcklin, and Jessica Roberts. 2024. Testing, Socializing, Exploring: Characterizing Middle Schoolers’ Approaches to and Conceptions of ChatGPT. In Proceedings of the CHI Conference on Human Factors in Computing Systems (CHI ’24). Association for Computing Machinery, New York, NY, USA, Article 276, 1–17. https://doi.org/10.1145/3613904.3642332
People’s quality of life or socioeconomic status can greatly differ based on where they live, whether they live in different cities, different counties, or in different countries. These inequalities and disparities can be and have been measured using indicators related to the different facets of life: wealth, education, health, and even happiness. Communicating where and how those inequalities affect different people and geographical areas to the public in an effective and engaging way is imperative to progress towards a more equitable society. Information visualization, and specifically maps, are a successful mechanism for conveying these differences in quality of life and engaging people in caring about larger issues and other people.
This project investigates how people perceive socioeconomic disparities using an interactive choropleth map visualization where users can change the map to display different socio-demographic indicators, including income inequality, life expectancy, educational attainment, rate of incarceration, and prevalence of HIV/AIDS and obesity. We implemented two versions of the interface: one displaying the United States only by county, and another arranging the United States map and a country-level choropleth map of the world by country, side-by-side. We conducted between-subjects A/B user testing where we surveyed and interviewed users before and after interacting with one version of the map.
Figure 1: Choropleth map of the Secondary Educational Attainment indicator in the United States only, by countyFigure 2: Choropleth map of the Secondary Educational Attainment indicator in the United States, by county (on the right) and in the world, by country (on the left)
We hypothesize that interacting with either map will lead to stronger feelings about the intensity of inequality in the U.S., and more confidence in their opinions on disparities. Additionally, we hypothesize that interacting with a contextualized map of the U.S. within the world will influence the user’s perceptions of the U.S. differently than when interacting with the U.S. map only.
When Sulfur Oxides (SOx) are emitted from power plant facilities, they do not fall directly to the ground. They are carried by air currents, sometimes great distances. Modeling of atmospheric transport and dispersion of these particles can estimate fine particulate matter (PM2.5) source impacts attributable to SOx emissions from each of the more than 1,200 coal-fired electricity generating units in operation in the United States between 1999-2018.
The Coal Pollution Impacts Explorer (C-PIE) is a web-based interface designed to visualize and scaffold atmospheric data and modeling for a public audience. Users can investigate the sources of pollution in their home county’s air, examine where pollution from a nearby facility disperses, and explore trends over time as facilities install pollution-mitigating scrubbers in response to legislative actions.
Research on the C-PIE platform investigates how data interactions can be scaffolded to support inquiry and engagement for public audiences.
Below you will find representations of some of our iterative development work on the platform. To read more about the impacts of coal pollution, read our recent article in the Journal Science:
Henneman, L., Choirat, C., Dedoussi, I., Dominici, F., Roberts, J., & Zigler, C. (2023). Mortality risk from United States coal electricity generation. Science, 382(6673), 941-946. https://doi.org/10.1126/science.adf4915